
KS3 Physics · Motion & pressure
Distance-time graphs
- What the axes and the line of a distance-time graph show
- Stationary, steady, faster and speeding up: reading the shape
- Working out speed from the gradient, with units
- Drawing a distance-time graph from a table
- 5 min read
- 5 quick questions
- Free homework sheet
- Years 7 to 9
Revision notes
A distance-time graph shows how far an object has travelled at each moment of a journey. The steeper the line, the faster the object is moving; a flat line means it has stopped.
What does a distance-time graph show?
Time goes along the horizontal axis (the x-axis) and distance up the vertical axis (the y-axis), each labelled with its unit, such as “Time (s)” and “Distance (m)”. Every point on the line says how far the object is from its starting point at that moment. In the graph above, at 100 s the walker is 150 m from home.
The graph is not a picture of the route: a line going up does not mean going uphill. It only shows distance changing with time.
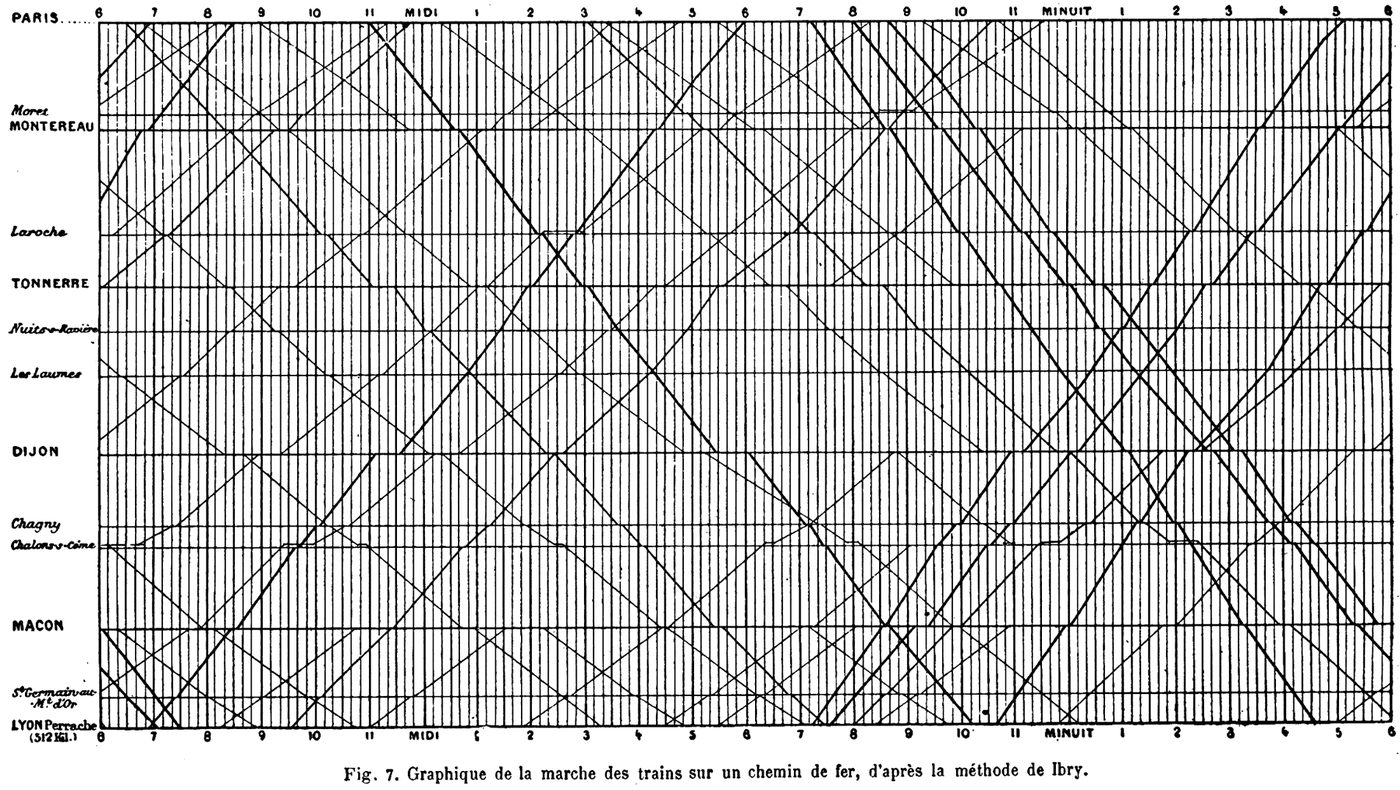
What do the shapes of the line mean?
| The line is | What the object is doing |
|---|---|
| Flat | Stationary: the distance is not changing |
| Straight, sloping | Moving at a steady speed: the same distance every second |
| Steeper | Moving faster |
| Curving up | Speeding up: the line gets steeper |
| Flattening off | Slowing down: the line gets less steep |
| Sloping down | Coming back towards the start (on a graph of distance from the start) |
In the walk at the top of the page, section B is flat: the walker stopped for 150 s. Section C is steeper than section A, so she was going faster. In section D the distance from home falls back to zero as she walks home.
How do you work out speed from a distance-time graph?
The steepness of the line is its gradient: how much it rises for each step along. On a distance-time graph the rise is a distance and the step along (the run) is a time, so the gradient is distance ÷ time, which is the speed.
- Choose a straight part of the line and draw a big triangle under it: a big triangle is easier to read accurately.
- Read the rise, the change in distance, up the side of the triangle.
- Read the run, the change in time, along the bottom.
- Speed = rise ÷ run, with units.
In section A of the walk, the line rises from 0 m to 300 m between 0 s and 200 s. What was her speed?
speed = change in distance ÷ change in time
speed = 300 m ÷ 200 s = 1.5 m/s
Section C: 300 m ÷ 100 s = 3 m/s, twice as fast, and the line is twice as steep.
The bus graph is in kilometres and minutes. What is the bus’s speed in m/s?
rise = 6 km − 3 km = 3 km = 3000 m
run = 10 min − 5 min = 5 min = 5 × 60 = 300 s
speed = 3000 m ÷ 300 s = 10 m/s
For a whole journey, the average speed is the total distance ÷ the total time, read from the start and end of the line, stops included.
How do you draw a distance-time graph?
- Put time on the horizontal axis and distance on the vertical axis, and label each with its unit.
- Choose scales that go up in equal steps and use most of the grid.
- Plot each pair of readings from the table as a small, neat cross.
- Join the points with a ruler where the speed is steady, or a smooth curve where it changes.
A toy car that moves 0.5 m every second gives points (1 s, 0.5 m), (2 s, 1.0 m), (3 s, 1.5 m) and so on: a straight line through the origin (the corner of the graph, where time and distance are both zero), because its speed is steady.
Stretch When the line curves, the speed is different at every moment. To find the speed at one moment, draw a tangent: a straight line that just touches the curve at that point, sloping the same way as the curve there. The gradient of the tangent is the instantaneous speed at that moment.
Written to the KS3 national curriculum. Last changed 15 November 2026.
Key words
Say them, spell them, use them in an answer.
- distance-time graph
- stationary
- steady speed
- gradient
- rise
- run
- speeding up
- average speed
Common misconception
Often said“A line going down on a distance-time graph means the object is slowing down.”
In factOn a graph of distance from the start, a line sloping down means the object is coming back towards the start. Slowing down shows as a line that gets less steep, flattening off.

Did you know?
Usain Bolt’s fastest 20 m
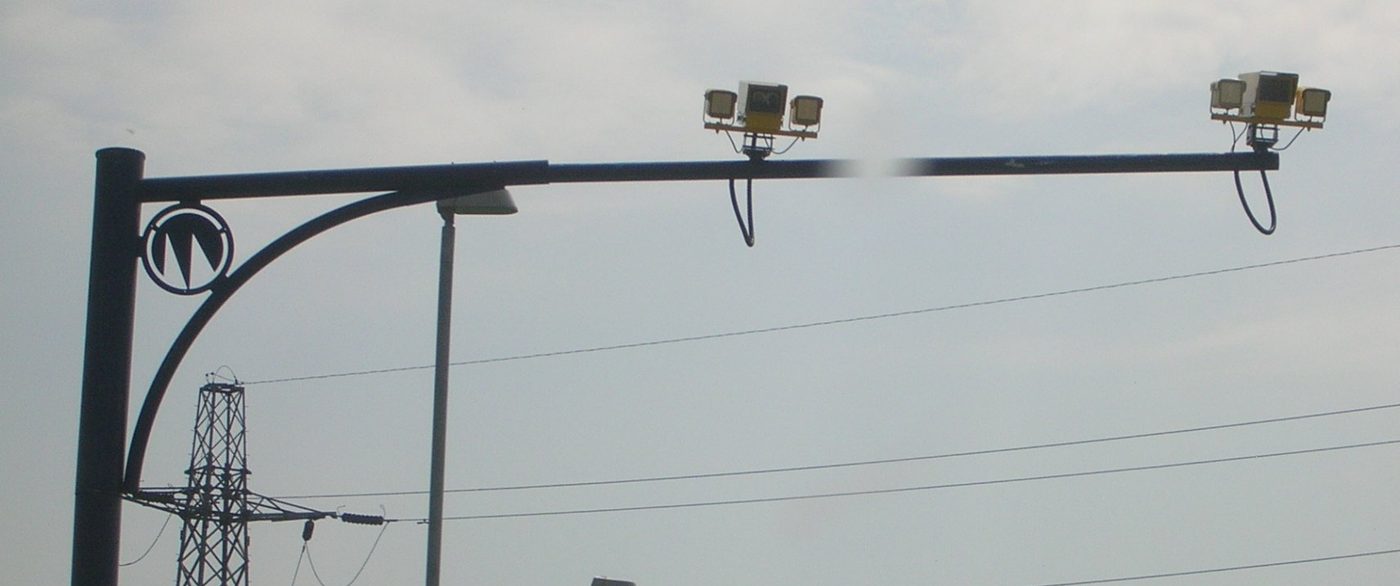
Usain Bolt won the 100 m at the Beijing Olympics in 2008, and a year later set the world record of 9.58 s in Berlin. In that race he ran from 60 m to 80 m in 1.61 s: about 12.4 m/s, or 45 km/h. Splits timed every 10 m let scientists draw the distance-time graph of the whole race.
Photo: Richard Giles, CC BY-SA 2.0, via Wikimedia Commons
Try 5 questions
Quick questions on distance-time graphs, marked as you go. Each one explains the answer.
Question 1 of 5
The line on a distance-time graph curves upwards, getting steeper and steeper. What is the object doing?
Choose an answer. Each question explains itself.
The homework sheet
About twenty minutes. Everything on it is in the notes above; the answers are on the last page.
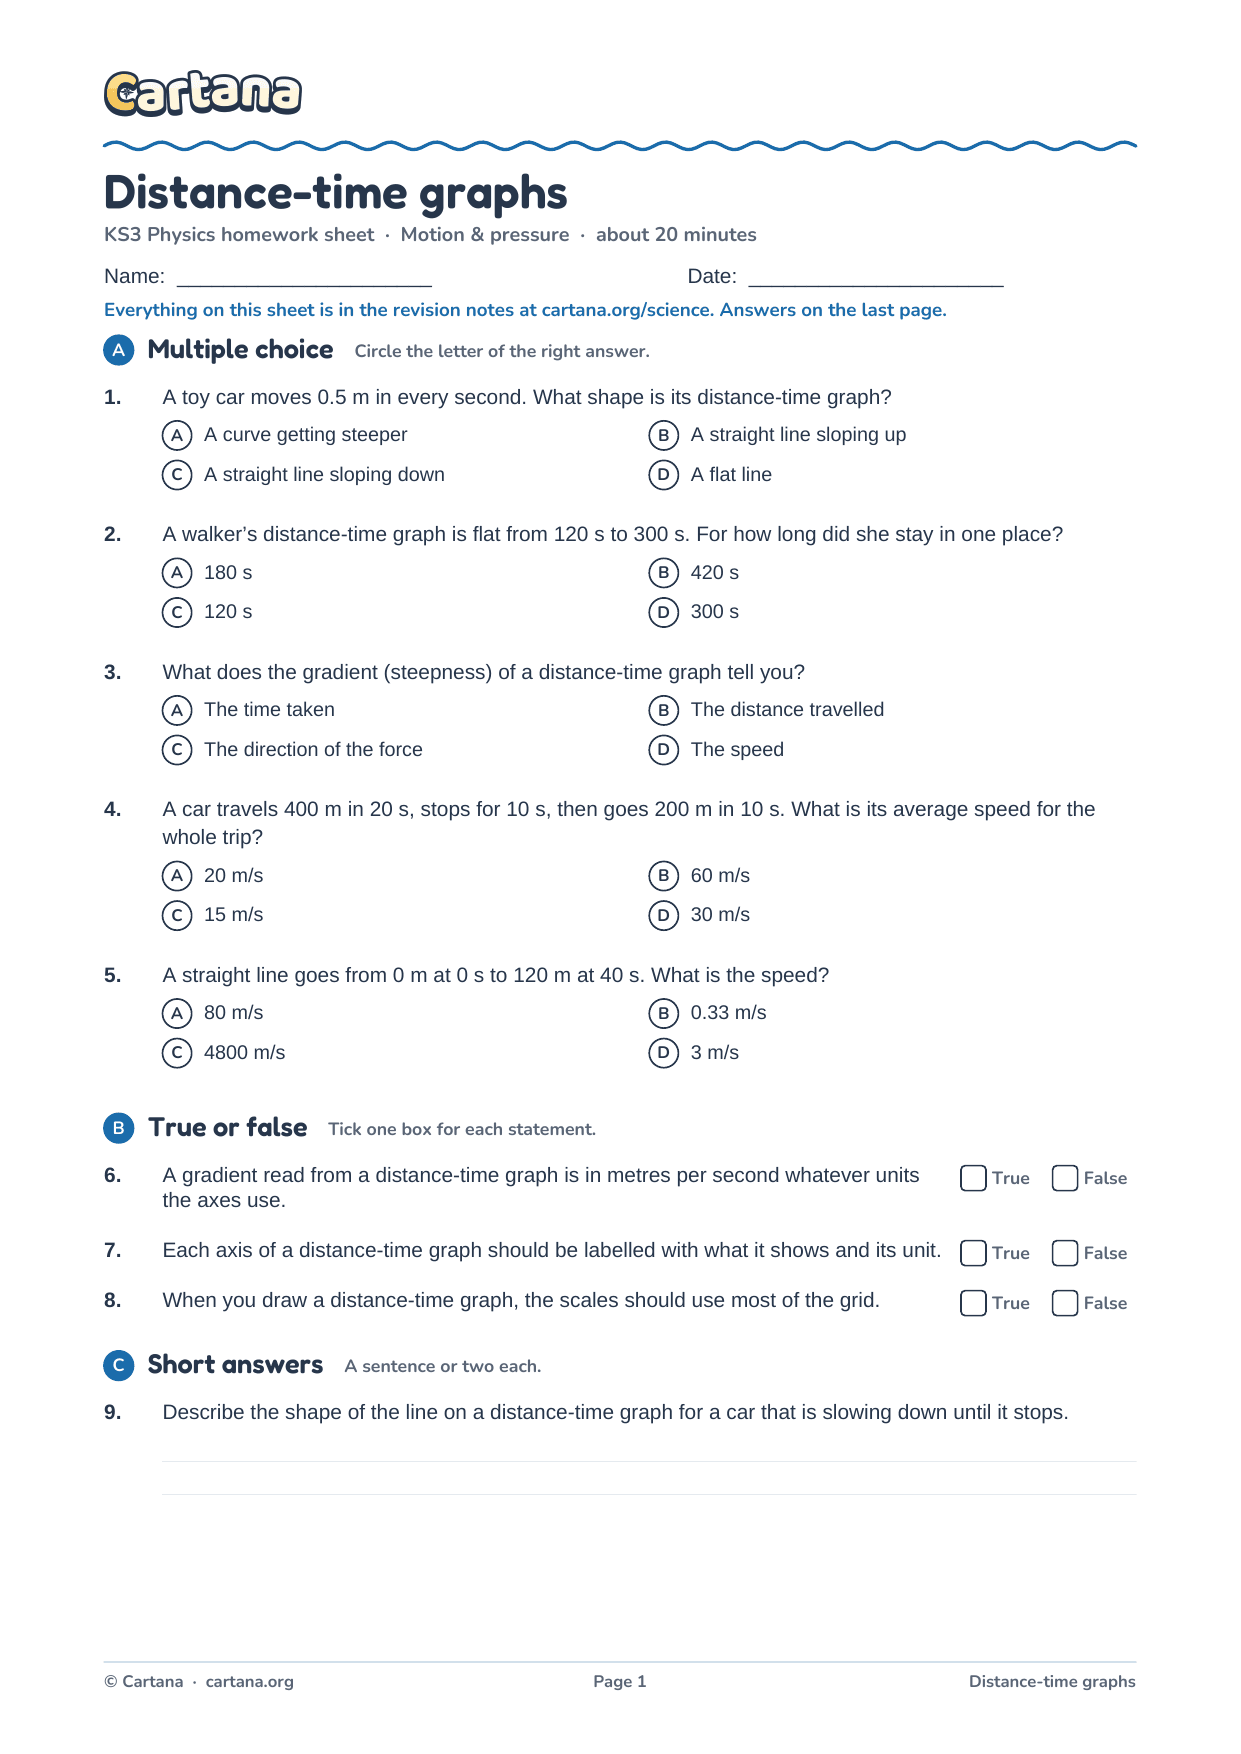
Free homework sheet
Distance-time graphs homework sheet
17 questions, about twenty minutes, with the answers on the last page: multiple choice, true or false, short answers, key words to define and one to explain in full.
KS3 Motion & pressure
Revised the whole unit?
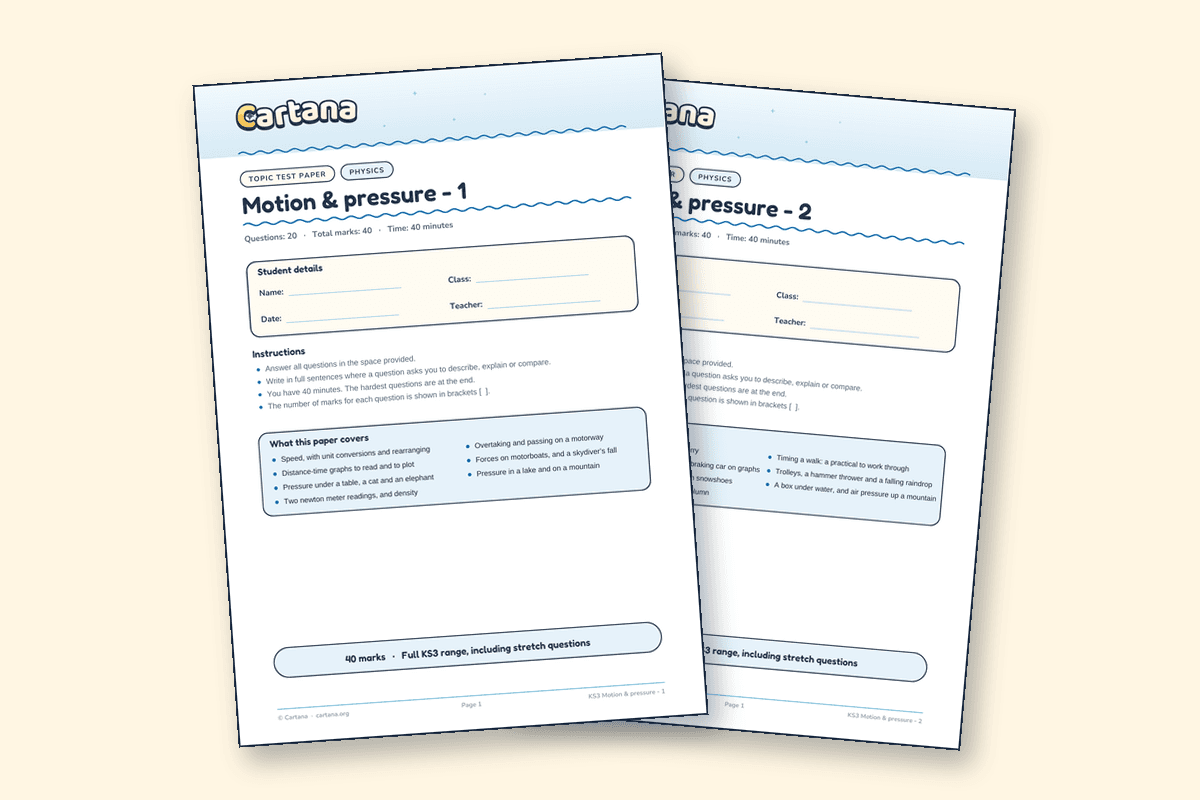
When every topic in motion & pressure is done, two different papers test the whole unit, each with its own mark scheme.


 Watch the trailer · 1:06
New from Cartana · Beta test 1–31 December
Revision that feels like an adventure
Cartana is our KS3 learning adventure: sail between islands, answer quick-fire questions and battle bosses. It starts with science, with maths on the way, and launches in 2027. This December a small group of testers gets to play it first.
In the Cartana adventure, every science unit is an island to explore. The island for motion & pressure is being built.
- Play the game before its official release
- Help us build it with your feedback
- Earn exclusive in-game items in return
More in this unit
Motion & pressure
- 1SpeedSpeed = distance ÷ time, units and converting them, average speed and relative motion
- 3Forces and motionNextHow a resultant force starts, stops, speeds up, slows down or turns an object, and what happens as things fall
- 4Pressure on solidsPressure = force ÷ area, in N/m² and N/cm², with snowshoes, drawing pins and calculations
- 5Pressure in liquids and gasesPressure in fluids acts in all directions and increases with depth; dams, divers and atmospheric pressure
- 6Floating and sinkingUpthrust, floating when upthrust equals weight, density, ships and submarines