
KS3 Working scientifically
Analysing results
- Calculating a mean, leaving out anomalous results
- Spotting an anomalous result in a table or on a graph
- Writing a conclusion: the pattern, the data and the science
- Evaluating a method: errors, improvements, accurate and precise
- 2 min read
- 5 quick questions
- Free homework sheet
- Years 7 to 9
Revision notes
Once the results are in, calculate a mean for each set of repeats, look for any anomalous result, write a conclusion that quotes the data, and finish with an evaluation of the method.
Calculating a mean
- Leave out any anomalous result.
- Add up the rest.
- Divide by how many you added.
- Round to the same number of decimal places as the readings.
Three repeats give 31 s, 33 s and 52 s. The 52 s reading is anomalous, so mean = (31 + 33) ÷ 2 = 32 s.
Anomalous results
- A result that doesn’t fit the pattern: far from the other repeats in a table, or far from the line of best fit on a graph.
- Usually caused by a measuring mistake, or a variable that wasn’t controlled.
- Circle it, repeat it if you can, and leave it out of the mean and the line of best fit.
Conclusions
- Describe the pattern: “As the temperature increased, the time decreased.”
- Quote data from your results.
- Explain it using science, and say whether it supports your prediction.
- Positive correlation: both increase. Negative correlation: one increases as the other decreases. Directly proportional: a straight line through (0, 0).
Evaluating
- Was it a fair test? Were the repeats close together? Were there anomalies?
- Sources of error: e.g. reaction time with a stopwatch, judging an end point, a temperature that drifted.
- Improvements must be specific: use a water bath, a data logger, more repeats, or more values. “Be more careful” is not an improvement.
- Accurate: close to the true value. Precise: repeat measurements close together.
- Repeatable: the same person gets similar results. Reproducible: someone else, or another method, gets similar results.

Written to the KS3 national curriculum. Last changed 8 November 2026.
Key words
Say them, spell them, use them in an answer.
- mean
- anomalous result
- conclusion
- evaluation
Common misconception
Often said“Anomalous results should be included when you calculate a mean.”
In factLeave them out, or they drag the mean away from the true value.
Try 5 questions
Quick questions on analysing results, marked as you go. Each one explains the answer.
Question 1 of 5
Sam’s sugar took 31 s, 33 s and 52 s to dissolve. What most likely caused the 52 s result?
Choose an answer. Each question explains itself.
The homework sheet
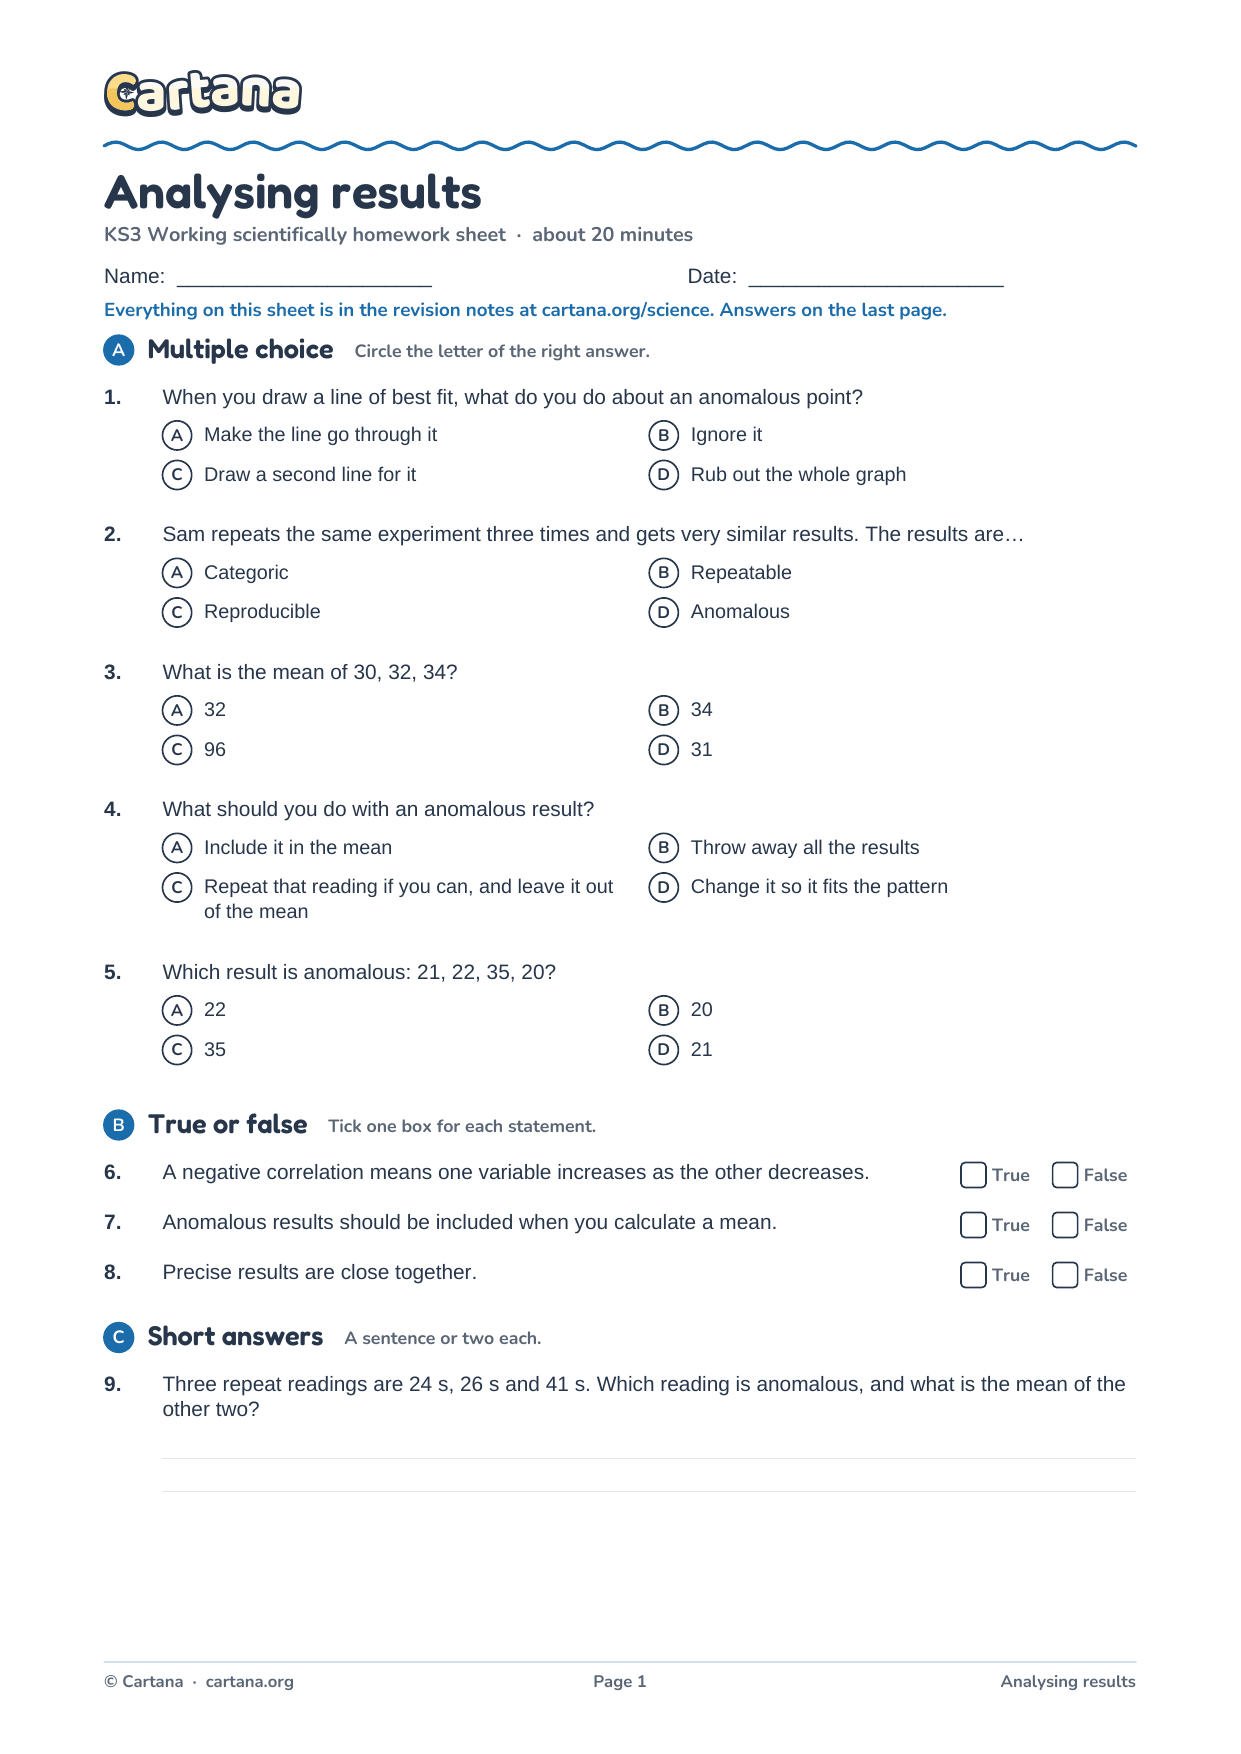
About twenty minutes. Everything on it is in the notes above; the answers are on the last page.
Free homework sheet
Analysing results homework sheet
17 questions, about twenty minutes, with the answers on the last page: multiple choice, true or false, short answers, key words to define and one to explain in full.
KS3 Working scientifically
Revised the whole unit?
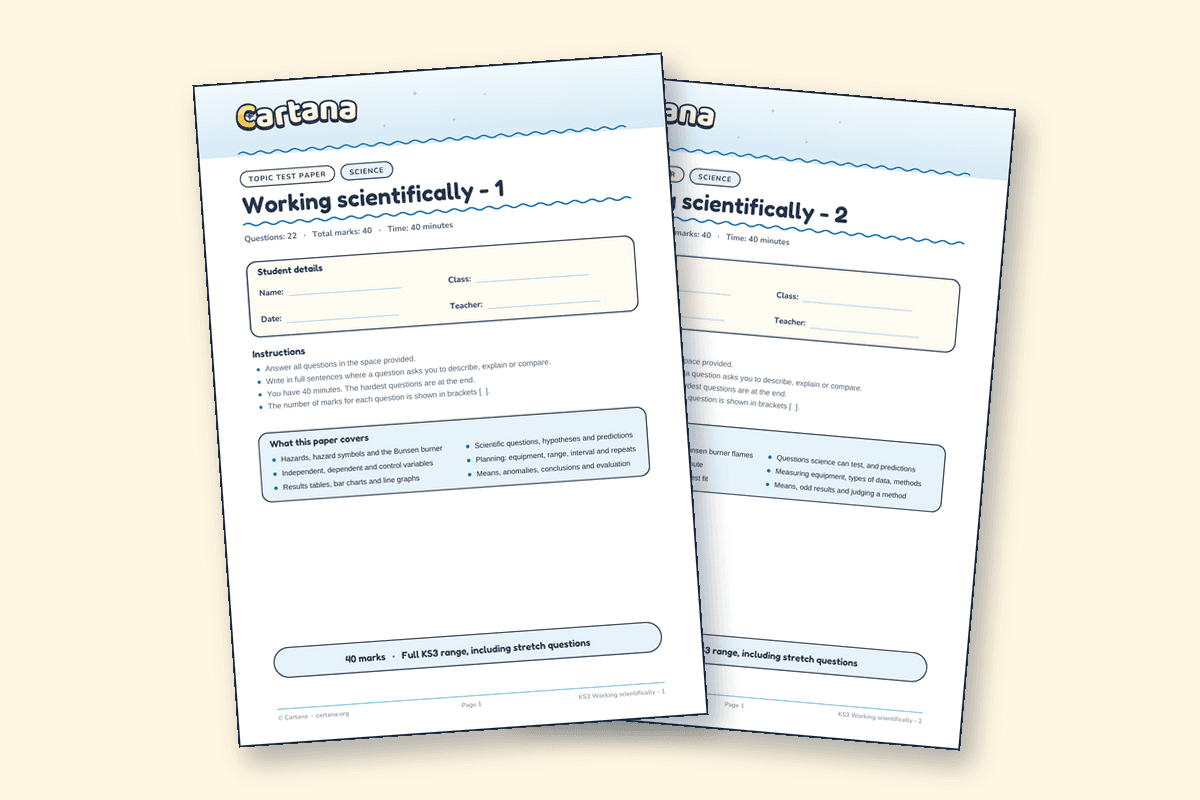
When every topic in working scientifically is done, two different papers test the whole unit, each with its own mark scheme.


 Watch the trailer · 1:06
New from Cartana · Beta test 1–31 December
Revision that feels like an adventure
Cartana is our KS3 learning adventure: sail between islands, answer quick-fire questions and battle bosses. It starts with science, with maths on the way, and launches in 2027. This December a small group of testers gets to play it first.
In the Cartana adventure, analysing results is the Courthouse, a district of the island Beakerford.
- Play the game before its official release
- Help us build it with your feedback
- Earn exclusive in-game items in return
More in this unit