
KS3 Working scientifically
Tables and graphs
- Laying out a results table: columns, headings and units
- Bar chart or line graph: choosing the right one
- Axes, labels, scales and plotting points
- Drawing a line of best fit
- 1 min read
- 5 quick questions
- Free homework sheet
- Years 7 to 9
Revision notes
Results go into a results table as you collect them, then onto a graph: a bar chart when the independent variable is categoric, a line graph when it is continuous. A line of best fit shows the pattern.
Results tables
- Independent variable in the first column, then the repeat readings, then the mean.
- Units go in the headings, in brackets. Just numbers in the table.
- Every value to the same number of decimal places.
| Temperature (°C) | Time 1 (s) | Time 2 (s) | Time 3 (s) | Mean time (s) |
|---|---|---|---|---|
| 20 | 61 | 59 | 64 | 61 |
| 40 | 31 | 33 | 30 | 31 |
| 60 | 18 | 17 | 19 | 18 |
Graphs
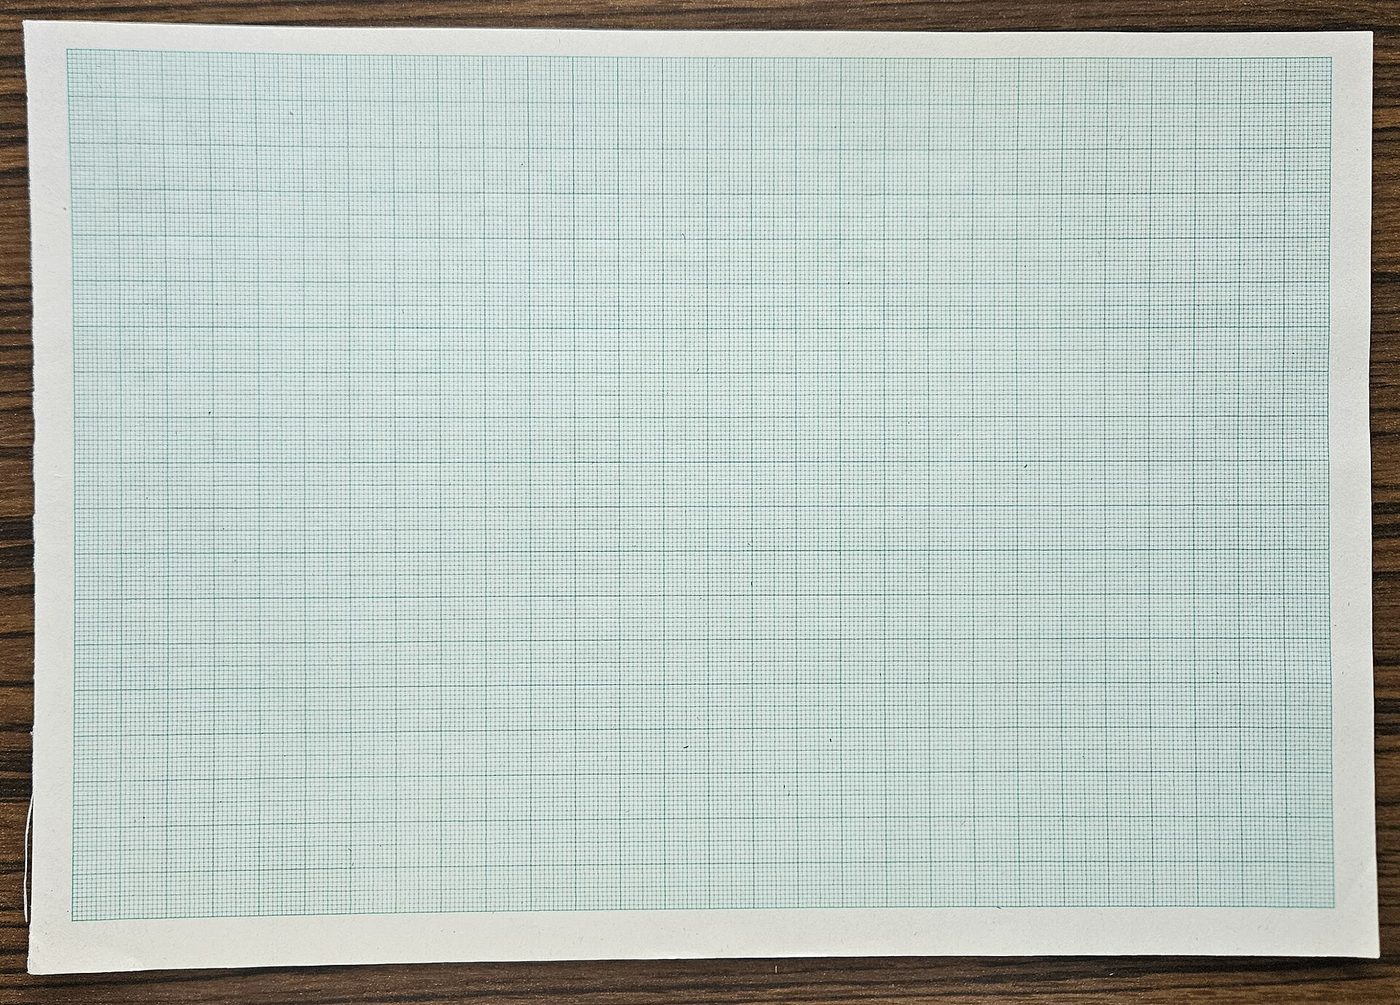
- Independent variable on the x-axis, dependent variable on the y-axis.
- Label both axes with the variable and its unit.
- Scales go up in equal steps and use more than half the grid.
- Plot points as small crosses, accurately.
- Bar charts: bars the same width, with gaps, and the y-axis starting at 0.
Lines of best fit
- A straight line or one smooth curve, depending on the pattern.
- Through the middle of the points, with about as many above as below.
- Ignore anomalies. Never join the dots.
- It doesn’t have to go through (0, 0) or through any particular point.
Written to the KS3 national curriculum. Last changed 8 November 2026.
Key words
Say them, spell them, use them in an answer.
- results table
- bar chart
- line graph
- x-axis
- y-axis
Common misconception
Often said“A line of best fit should join every point, dot to dot.”
In factDraw one straight line or smooth curve through the middle of the points.
Try 5 questions
Quick questions on tables and graphs, marked as you go. Each one explains the answer.
Question 1 of 5
A graph scale can go 0, 10, 20, 40, 50.
Choose an answer. Each question explains itself.
The homework sheet
About twenty minutes. Everything on it is in the notes above; the answers are on the last page.
Free homework sheet
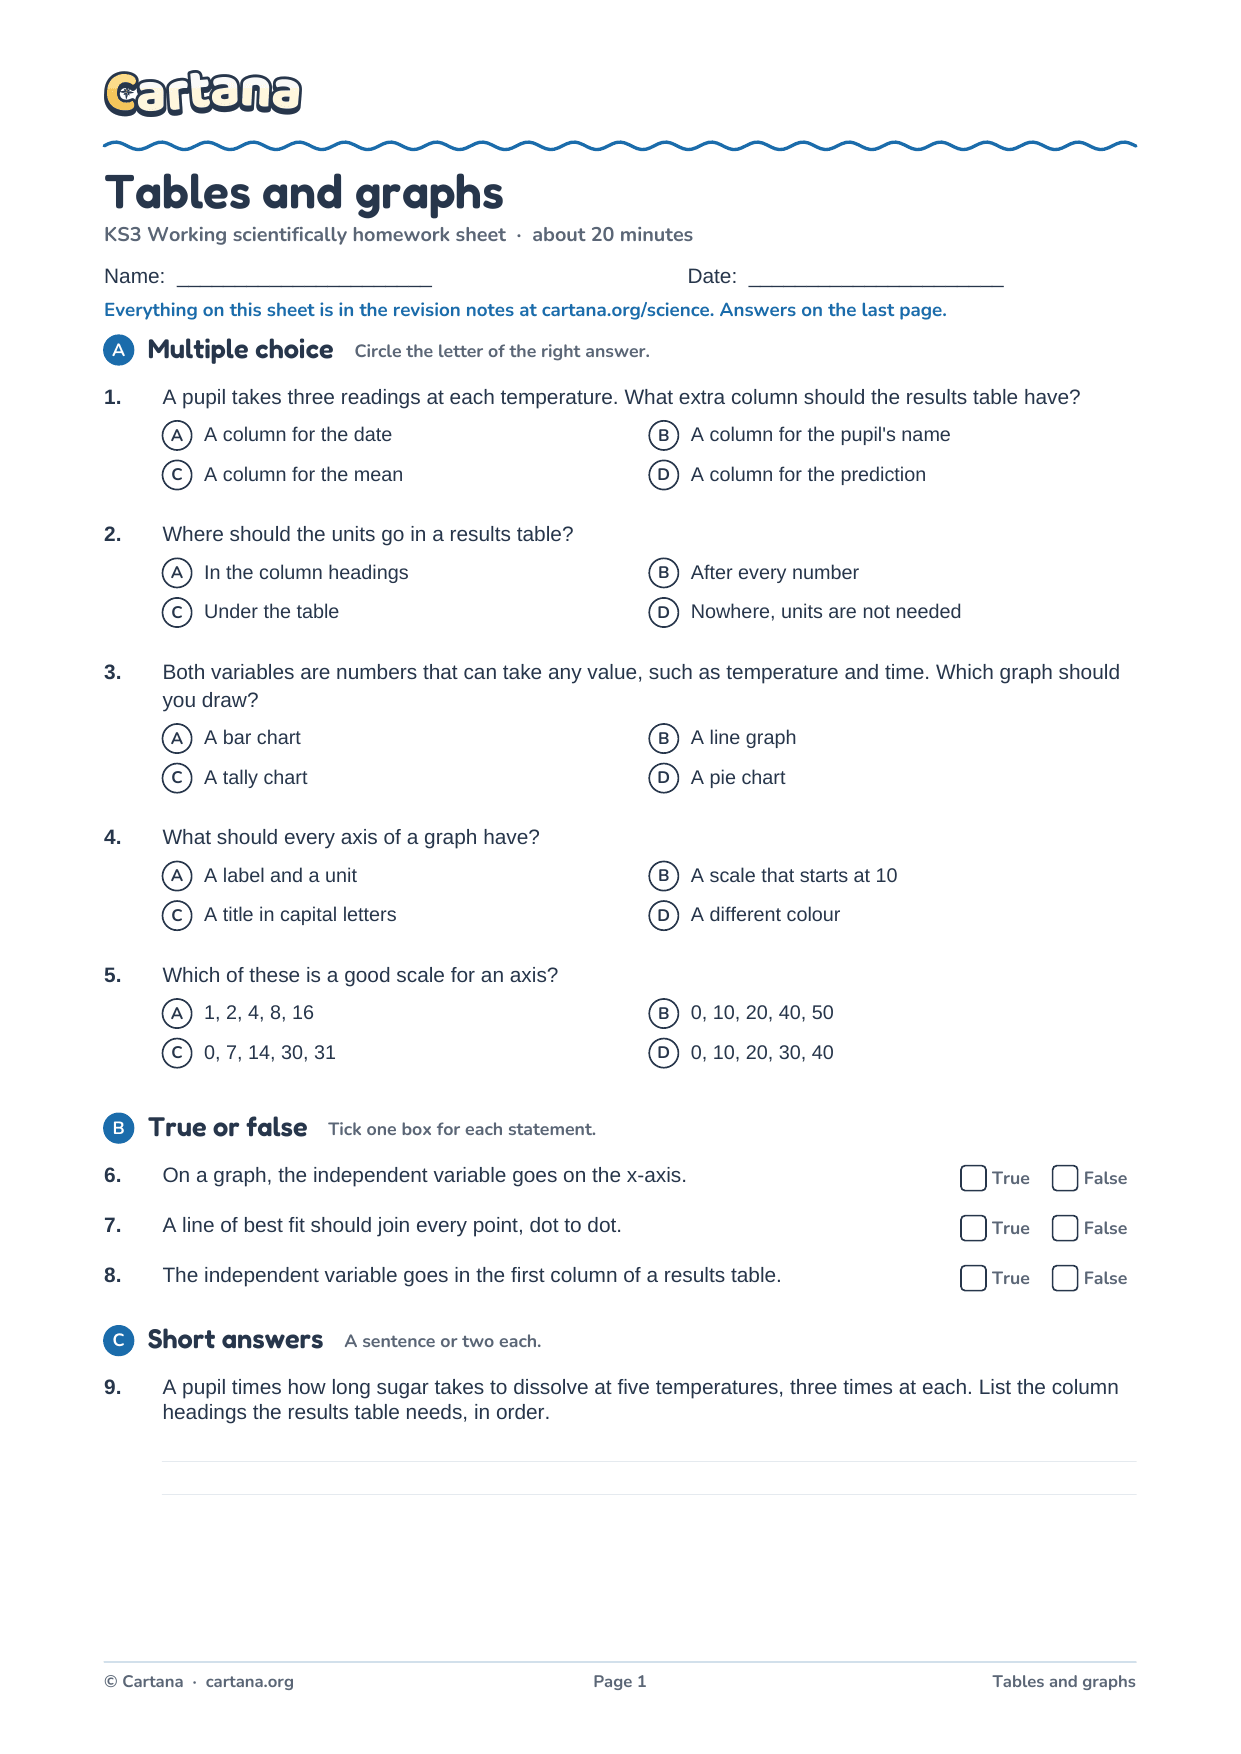
Tables and graphs homework sheet
17 questions, about twenty minutes, with the answers on the last page: multiple choice, true or false, short answers, key words to define and one to explain in full.
KS3 Working scientifically
Revised the whole unit?
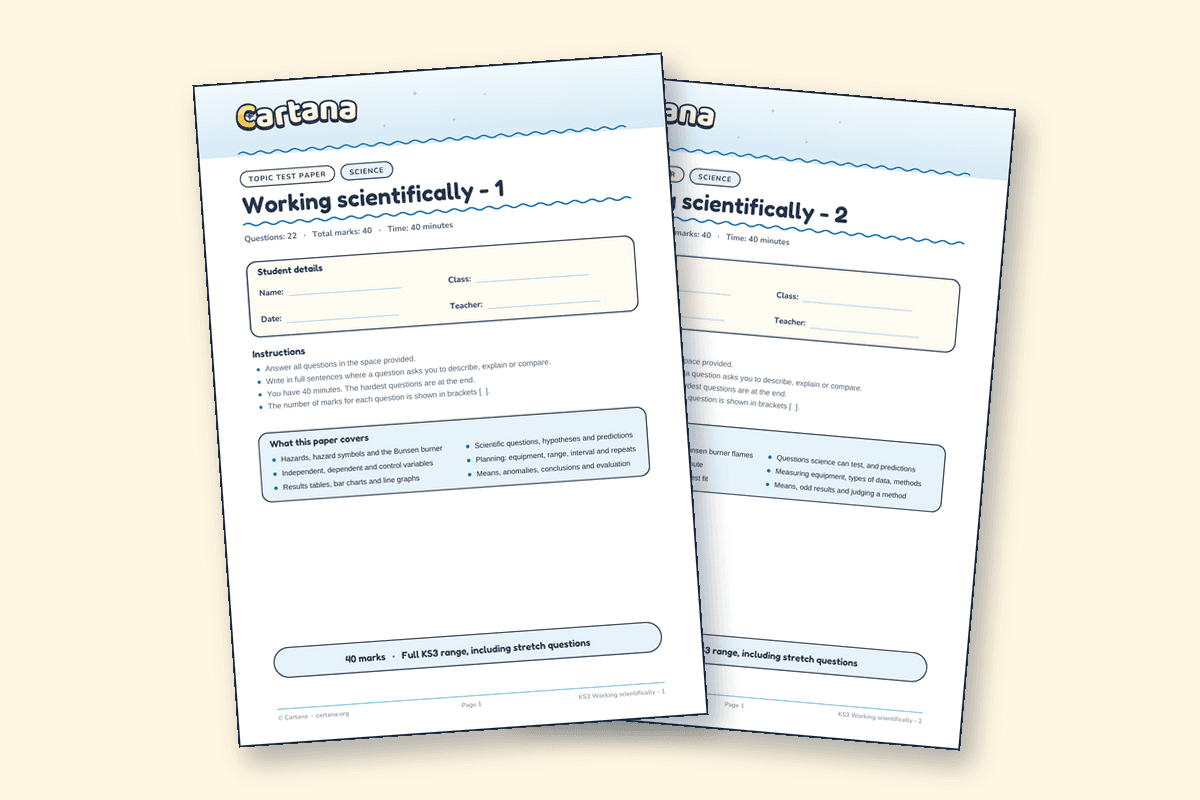
When every topic in working scientifically is done, two different papers test the whole unit, each with its own mark scheme.


 Watch the trailer · 1:06
New from Cartana · Beta test 1–31 December
Revision that feels like an adventure
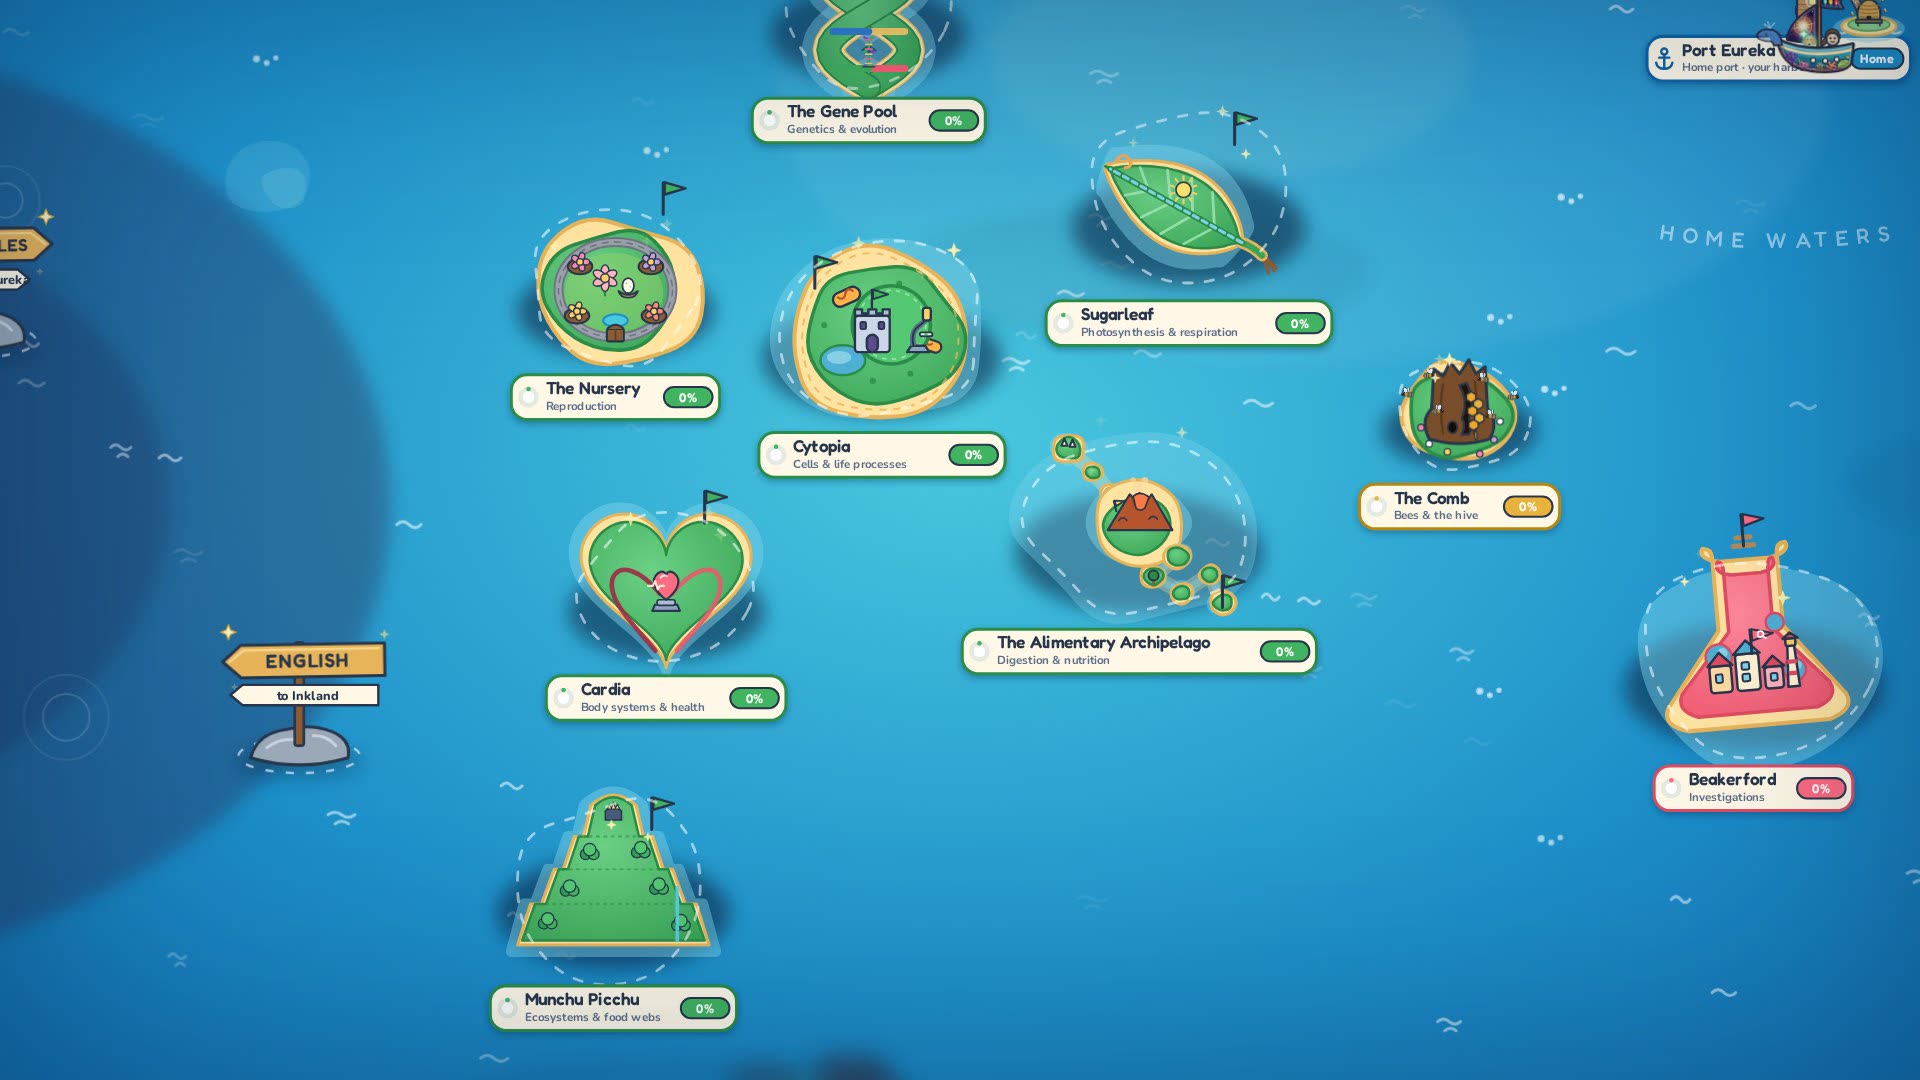
Cartana is our KS3 learning adventure: sail between islands, answer quick-fire questions and battle bosses. It starts with science, with maths on the way, and launches in 2027. This December a small group of testers gets to play it first.
In the Cartana adventure, tables and graphs is the Printworks, a district of the island Beakerford.
- Play the game before its official release
- Help us build it with your feedback
- Earn exclusive in-game items in return
More in this unit